rows().every(), columns().every() and cells().every() – Use when you want to perform an API method on each selected item, but there is a performance penalty.
each() – similar to every() but doesn’t create a new API instance and doesn’t change the callback function’s scope. Lower level.
iterator() – For all other data types that the DataTables API can carry we use the each() to access the data in the instance.
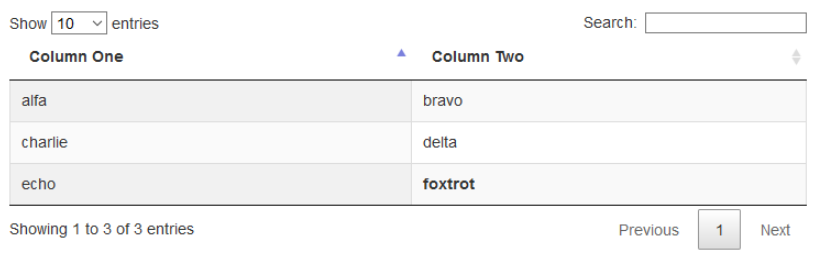
The Table
We assume a simple table containing the following:
Get only one cell without the HTML tags – row 3 column 2:
var oneSelectedCell = table.cell(2, 1);
var node = oneSelectedCell.node();
console.log(node.textContent);
Output:
foxtrot
One Column
Get column 2’s data:
var oneSelectedColumn = table.column(1).data();
for (var i = 0; i < oneSelectedColumn.length; i++) {
  console.log(oneSelectedColumn[i]);
}
Output:
bravo
delta
<b>foxtrot</b>
Get column 2’s data via the nodes:
var oneSelectedColumn = table.column(1).nodes();
for (var i = 0; i < oneSelectedColumn.length; i++) {
  console.log(oneSelectedColumn[i].textContent);
}
Output:
bravo
delta
foxtrot
Row Iterator
Use a ‘row’ iterator to get row 2:
table.rows(1).iterator( 'row', function ( context, index ) {
  console.log( $( this.row( index ).node() ) );
} );
Column Iterator
Use a ‘column’ iterator to get each column:
table.columns().iterator( 'column', function ( context, index ) {
  console.log( context );
  console.log( index );
  console.log( $( this.column( index ) ) );
} );
The slice() Function
table.rows().every( function ( ) {
  var data = this.data();
  // get a subset of the row data, excluding the first cell
  // if the values are stored as strings, map then to numbers
  var values = data.slice(1).map(Number);
  // the ... operator expands the array into values for the
  // max() function to operate on:
  console.log( data[0] + ': ' + Math.max( ...values ) );
} );
Here are links to (and notes about) some key pages from the DataTables documentation and web site. The documentation is extensive – and sometimes feels like a bit of a sprawl. These are items I have been referring to more frequently recently.
But it may be easier to iterate over a single column. The following function sums up values in the first column, if the checkbx in the second column is checked:
function doSum() {
  var table = $('#example').DataTable();
  var checkboxNodes = table.column(0).nodes();
  var amountData = table.column(1).data();

  var sum = 0;

  for (var i = 0; i < checkboxNodes.length; i++) {
    if( $(checkboxNodes[i]).find("input").is(':checked') ) {
	  sum += amountData[i];
	}
  }

  console.log(sum);
}
Utility Functions
map() – Create a new API instance with the result set defined by the values returned from the callback function.
toArray() – Create a native Javascript array object from an API instance.
to$() – Convert the API instance to a jQuery object, with the objects from the instance’s result set in the jQuery result set.
Excel options – In particular, see the customize and exportOptions descriptions:
customize – modify the XSLX file that is created by Buttons. It takes 3 parameters:
xlsx – object containing the excel files (see below)
btn – the button configuration object
tbl – the table’s DataTables API instance
exportOptions – selects the data to be exported, using the buttons.exportData() function described above.
Excel built-in styles – a short list of formatting styles provided in the spreadsheet created by DataTables.
Excel Files
The structure of the Excel files used in the above customize parameter:
{
    "_rels": {
        ".rels": xml
    },
    "xl": {
        "_rels": {
            "workbook.xml.rels": xml
        },
        "workbook.xml": xml,
        "styles.xml": xml,
        "worksheets": {
            "sheet1.xml": xml
        }

    },
    "[Content_Types].xml": xml
}
This is how the xlsx.xl.worksheets['sheet1.xml'] reference is constructed (see example below).
Example Code
(document).ready(function() {

  $('#example').DataTable( {

    dom: 'Bfrtip',
    buttons: [
      {
        extend: 'excelHtml5',
        title: '', // no title row in excel sheet
        text: 'Excel', // label for the export button
        // export everything except the first row and first col:
        exportOptions: {
          rows: function ( idx, data, node ) {
            if (idx > 0) {
              return data;
            }
          },
          columns: function ( idx, data, node ) {
            if (idx > 0) {
              return data;
            }
          }
        },
        // format the output with a thin black border on each cell:
        customize: function ( xlsx, btn, tbl ) {
          var sheet = xlsx.xl.worksheets['sheet1.xml'];
          $( 'row c', sheet ).attr( 's', '25' );
        }
      }
    ]

  } );

} );
Another exportOptions fragment – this time for modifying header data (and there is also format.body and format.footer):
exportOptions: {
  format: {
    header: function ( data ) {
      var n = data.indexOf("<select>");
      if (n > -1) {
        return data.substring(0, n);
      } else {
        return data;
      }
    }
  }
}
Search Plug-In
The DataTables search plug-in is accessed using the following:
$.fn.dataTable.ext.search
This allows you to provide completely customized searching.
The official example for a range search uses the following code:
$.fn.dataTable.ext.search.push(
    function( settings, searchData, index, rowData, counter ) {
        var min = parseInt( $('#min').val(), 10 );
        var max = parseInt( $('#max').val(), 10 );
        var age = parseFloat( searchData[3] ) || 0; // using the data from the 4th column

        if ( ( isNaN( min ) && isNaN( max ) ) ||
             ( isNaN( min ) && age <= max ) ||
             ( min <= age   && isNaN( max ) ) ||
             ( min <= age   && age <= max ) )
        {
            return true;
        }
        return false;
    }
);
Be aware: $.fn.dataTable.ext.search is an array – which is why you push() your search function onto it. If you want to use multiple different custom search functions, you need to pop() the unwanted one off the array first:
When working with dot notation, property identifiers can only be alphanumeric (and _ and $). Properties cannot start with a number, or contain periods.
If a JSON key contains dots as part of its text, for example…
"foo" : { "baz.bat": "value" }
…then this will interfere with the dot notation process.
Alternatively, you can use JavaScript bracket notation to navigate into a data hierarchy:
foo["baz.bat"]
Naming Standards
DataTables has two naming standards:
older Hungarian notation names (for versions prior to 1.10)
newer camelCase names (from 1.10 onwards)
If you are using the latest version of DataTables (from version 1.10 onwards), you can use either the new naming standard or the old one:
Orthogonal data is described here. It allows you to store different versions of a data item. For example, the display value of a date may be Mon 23rd Feb, 2019 but the sort value may be 20190223.
Orthogonal data has the following types:
display
sort
filter
type
The first three are self-explanatory. The type type is used for “type detection”.
What does that mean?
DataTables supports automatic detection of different data types. See columns.type for background. The type type, as described on this page:
The type detection plug-in documentation does not shed much additional light on this. An answer from the DataTables forum indicates that this is not something we should typically need to handle, outside of the above advice to “match the sort value”.
The DataTables API
There are three main ways to access the DataTables API:
$( selector ).DataTable();
$( selector ).dataTable().api();
new $.fn.dataTable.Api( selector );
See here for details and notes explaining the differences between these syntaxes. In summary:
The result from each is an instance of the DataTables API object which has the tables found by the selector in its context. It is important to note the difference between $( selector ).DataTable() and $( selector ).dataTable(). The former returns a DataTables API instance, while the latter returns a jQuery object.
If you need to access the DataTables API from within a DataTable callback function, you can use the JavaScript this keyword.
The following render function can be used in combination with DataTables orthogonal data support:
$('#example').DataTable( {
  columnDefs:[{
    targets: 4,
    render: function ( data, type, row ) {
      //console.log(data); // the raw date as a string
      var d = moment(data, 'DD-MM-YYYY'); // converted to a moment object
      var sortString = moment(d).format('YYYYMMDD'); // converted to a new string format
      //console.log(sortString);
      var cellContents = '<center>' + data + '</center>';
      if ( type === 'display' || type === 'filter' ) {
        return cellContents;
      } else {
        return sortString;
      }
    }
  }]
} );
DateTime Plug-In
This is introduced here. The plug-in can be incorporated using this – but also relies on the above moment.js library:
DataTables will automatically checking to see if the data in a column matches any of the given datetime types you have registered using $.fn.dataTable.moment().
It also uses the DataTables ordering extension ($.fn.dataTable.ext.type.order) to automatically provide sorting for your registered date formats.
HTML5 Attributes
Another “orthogonal data” approach is to use DataTables support for HTML5 attributes. For example:
In GitHub the PHP source files for server-side processing examples are here. This is where you can find the ssp.class.php file which is used by this example.
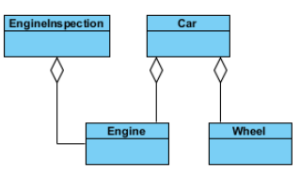
A tail is a part of both dogs and cats (aggregation/composition)
A cat is a kind of pet (inheritance/generalization)
Aggregation and Composition
Aggregation and Composition are subsets of association meaning they are specific cases of association. In both aggregation and composition object of one class “owns” object of another class. But there is a subtle difference:
Aggregation implies a relationship where the child can exist independently of the parent. Example: Class (parent) and Student (child). Delete the Class and the Students still exist.
Composition implies a relationship where the child cannot exist independent of the parent. Example: House (parent) and Room (child). Rooms don’t exist separate to a House.
Generalization is implemented as inheritance.
Inheritance: “is-a”; composition: “has-a”.
Visibility of any class members are marked by notations of:
The cognitive complexity definition is how capable people perceive things in their world. It also describes the number of cognitive processes required to complete a task. Things that are complicated to perform have more processes involved than simple tasks.
Making a sandwich, for example, is a simpler task than writing a term paper. Many more cognitive processes are involved in writing the paper, such as using online resources, doing effective research, and writing within a specific style and tone. Cognitive complexity can also help individuals analyze situations more accurately by allowing them to see shades of nuance and meaning more clearly. The core determining factor in the complexity of an individual’s cognition is their life experience and education. Exposure to complex situations, either through life experience or education and training, allows individuals to form mental constructs.
Expounding upon this theory of what is cognitive complexity is the personal construct theory, which states that individuals interpret the world through mental constructs. These constructs serve as shortcuts, aiding individuals in quickly analyzing situations and tasks. For example, someone could color-code their notebooks to make it easy to identify which notebooks are for which subjects, rather than sifting through multiples of the same color notebook. Mental constructs make it easier to solve complex problems by breaking down parts of the problem-solving process into automatic processes.
Cognitive complexity is also used in computer programming to help software engineers describe units of code. Cognitive complexity, in this sense, is how difficult it is to understand a unit of code in a program. Some functions and classes are straightforward and are easy to understand, while there are those with multiple parts with several logic breaks and references to other files that make it difficult to follow. Complex code is generally more prone to bugs because there are more areas for things to go wrong when the program is being executed. It also makes it more challenging to write new code that interacts with the old complex code, making rework necessary to simplify the code.
Cognitive Complexity Example
Imagine that there is an individual who is learning how to cook and opens their new cookbook to a recipe they’ve been considering. The recipe calls for several ingredients that they’ve never heard of before. So, they must take the time out to research these ingredients, figure out what they are, and search for them at the store. They also discover that they do not have a pan big enough to cook the meal, so they must also purchase a new pan capable of doing so. Meanwhile, an accomplished chef is making the same recipe. However, because they have more experience, they already know what the recipe calls for and have the ingredients in stock. They also already have the correct pan. The first individual consults the recipe for every step, lengthening the prep and cooking process. The chef knows the recipe by heart, so they get the meal prepped and cooked more quickly. In this cognitive complexity example, the chef has more mental constructs available to them from experience with the dish, resulting in less time spent prepping and cooking. They also know what ingredients do what, so if the flavor is off, they know what to add while the inexperienced individual might not.
Cognitive Complexity Communication
Cognitive complexity in communication refers to the number of psychological constructs an individual might use to describe someone. These psychological constructs generally refer to personality traits, like “energetic” or “caring.” Those who are more perceptive of others tend to use more psychological constructs to describe people. These people have higher interpersonal cognitive complexity, allowing them to notice more details about a person than somebody with less skill. An average individual might describe someone as “friendly,” while the person with higher interpersonal cognitive complexity will notice that they are also giving and self-confident.
Uses of Cognitive Complexity Theory
As mentioned previously, cognitive complexity is a topic that is used in software development to describe how complex a given piece of code is. However, it is also used to design computers that think more as humans do. Computers process information through binary code, or ones and zeroes. They see the program to execute, and they do it. They do not pause for consideration or come up with creative solutions. So, software engineers and scientists are trying to develop ways in which a computer can think more like a human to solve more complex problems. These systems are called artificial intelligence. Artificial intelligence aims to develop computers capable of complex cognitive functions rather than simple functions like memory and perception. Teaching computers to see the nuances in different problems allows them to handle more complex situations in more optimal ways, rather than approaching a problem head-on in the most direct path.
In organizations, cognitive complexity refers to the ability of people to notice patterns in their organization so that they can optimize processes for efficiency. This capability requires seeing the organization in a broad sense and a specific one. Optimizing one part of an organization is a much simpler feat, where there are fewer variables to consider. Optimizing an entire organization requires the ability to see any potential bottlenecks, understand supply and demand, know market trends, and much more. If a company is underperforming, leaders need to be able to recognize why it is happening and come up with solutions to the problem. Cognitive complexity allows people to think outside the box and develop creative solutions.